| Version 4 (modified by lttoth@…, 8 years ago) (diff) |
|---|
Monitoring Shibboleth Idp v3
Alerts and Statuses
There are two components to monitoring the Shib v3 production system, alerts and status indicators. Alerts are forwarded by the Pager Duty Application and status is managed by NEGSUE.
Pager Duty
Negsue Monitoring Page
Once notified that a situation is critical, examination of the NEGSUE page provides more insight into the issues. The URL https://negsue.alaska.edu opens to a list of clients monitored by NEGSUE.
(1) NEGSUE U Alaska Client List by Server Name

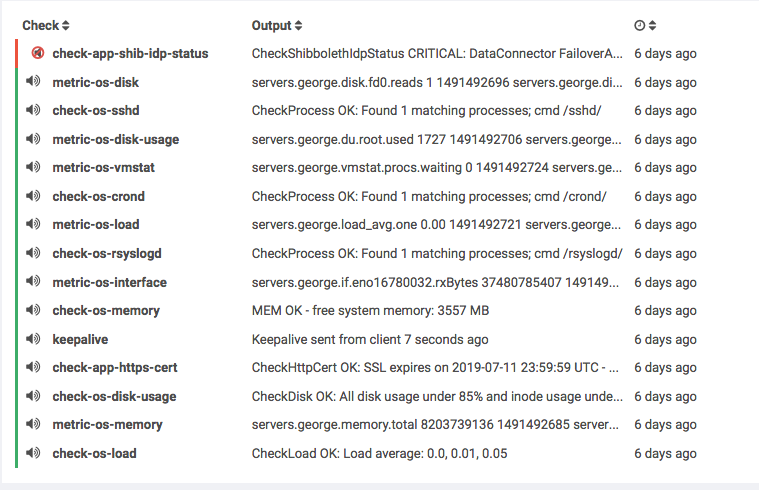
Shibboleth v3 Idp is served by george.alaska.edu. Clicking on george takes you to the status page for the server. Green side bar indicates all is good. Yellow sidebar is in a warning state. Red is critical.
(2) Shibboleth Status List
Status Definitions
check-app-shib-idp-status : Disabled
The custom status is not yet ready for production monitoring.
- Meaning:
- Contact:
metric-os-disk
- Meaning:
- Contact:
check-os-sshd
- Meaning:
- Contact:
metric-os-disk-usage
- Meaning:
- Contact:
metric-os-vmstat
- Meaning:
- Contact:
check-os-crond
- Meaning:
- Contact:
metric-os-load
- Meaning:
- Contact:
check-os-rsyslogd
- Meaning:
- Contact:
metric-os-interface
- Meaning:
- Contact:
check-os-memory
- Meaning:
- Contact:
keepalive
- Meaning:
- Contact:
check-app-https-cert
- Meaning:
- Contact:
check-os-disk-usage
- Meaning:
- Contact:
metric-os-memory
- Meaning:
- Contact:
check-os-load
Attachments
- Negsue_Client_List.png (95.6 KB) - added by lttoth@… 8 years ago.
- negsue_Shib_status.png (161.1 KB) - added by lttoth@… 8 years ago.
- CPU_Metrics.png (22.5 KB) - added by lttoth@… 8 years ago.

